Health Insurance Pricing Model
This project explores how health insurance premiums can be priced using a frequency–severity modelling framework. It combines classical actuarial methods with modern data visualisation to show how risk factors such as age, BMI, and smoking status influence expected healthcare costs. The final output is an interactive dashboard designed for both technical and non-technical users.
Category
Life Insurance
Language
R
Start Date
July 03, 2025
Designer
Sbusiso Mdingi
Health Insurance Pricing Model
This project demonstrates how a health insurance portfolio can be priced using a classical frequency–severity modelling framework in R. I built a full end-to-end actuarial workflow, from data simulation and risk classification to premium calculation and portfolio analysis — and deployed the results in an interactive pricing dashboard for non-technical users.
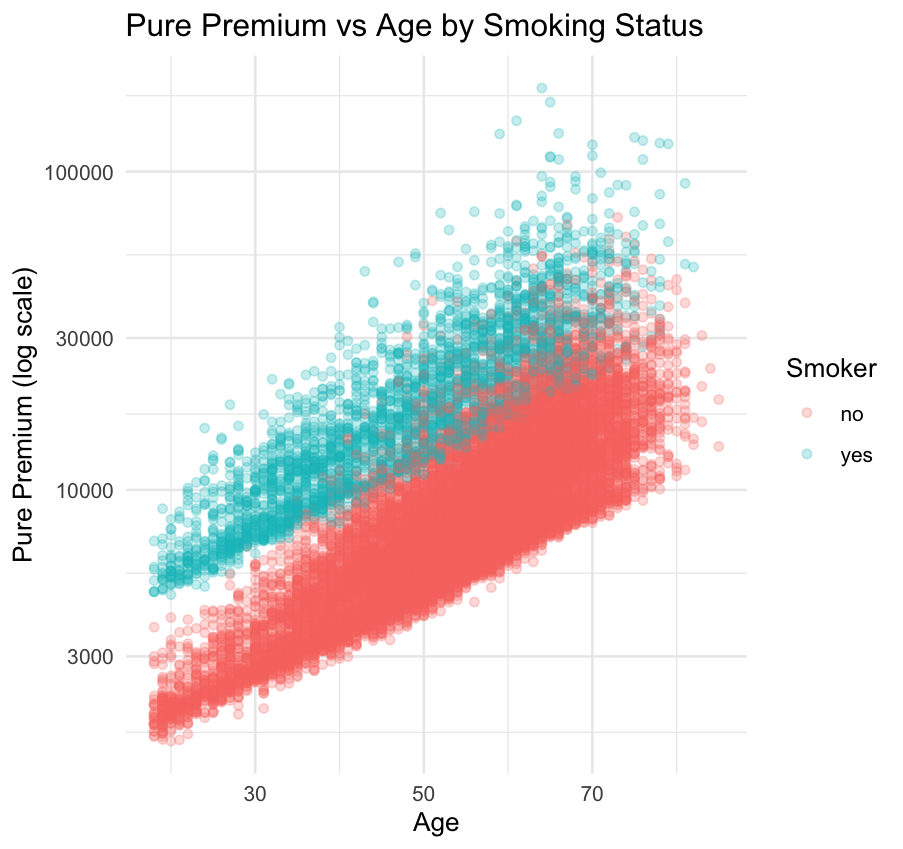
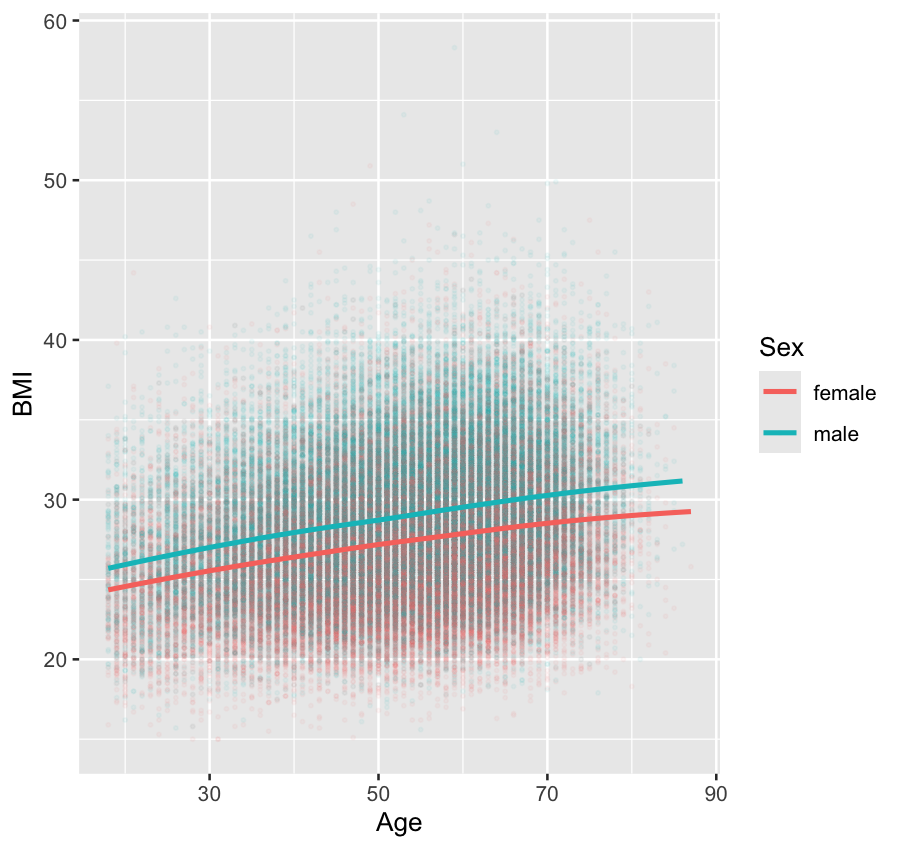
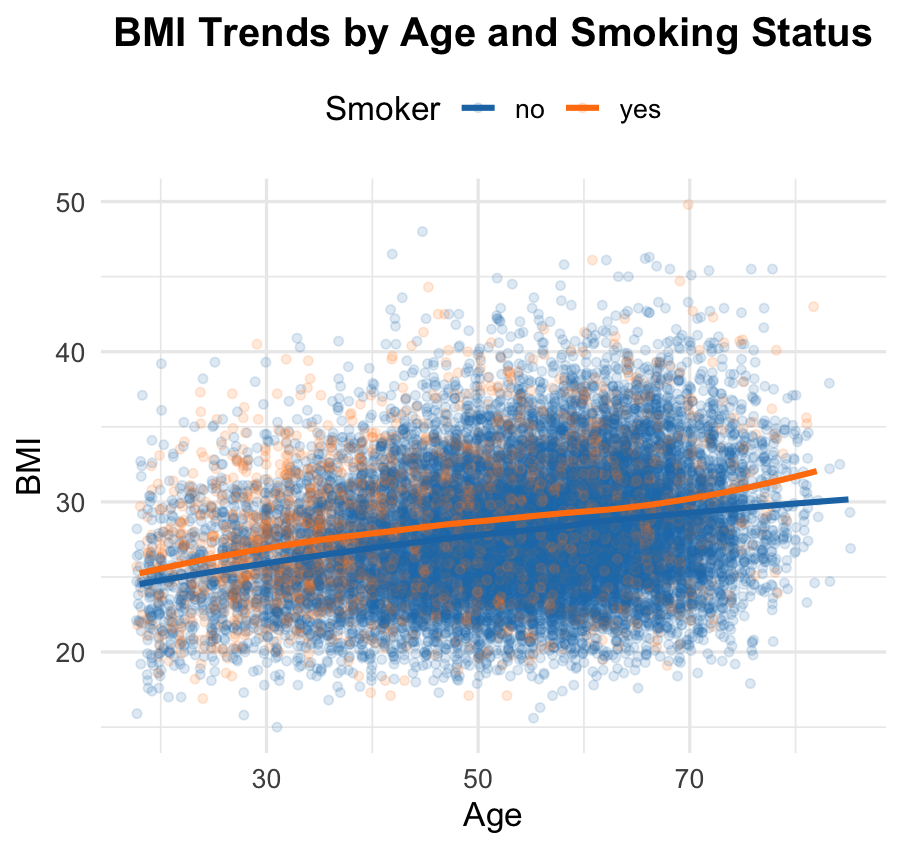
The objective was to model how often policyholders claim (frequency) and how large those claims tend to be (severity), using key rating factors such as age, BMI, smoking status, and number of dependents. These two components were then combined to estimate expected annual healthcare costs and generate risk-based premiums. The project mirrors how real insurers think about pricing, while remaining fully transparent and explainable.
FROM PROBLEM TO PRICING
Health insurance pricing is often perceived as opaque — most people see only the final premium, not the risk logic behind it. I wanted to bridge that gap by building a transparent, end-to-end pricing engine that demonstrates exactly how individual risk factors translate into real insurance costs. The goal was not just to predict premiums, but to clearly explain the “why” behind them in a way that both technical and non-technical users could understand.
This project was designed as a realistic simulation of how an insurer would approach portfolio pricing in practice: starting from raw risk characteristics, modelling claim behaviour, and converting expected losses into fair, risk-adjusted premiums. The final outcome is an interactive dashboard that allows users to explore how age, lifestyle, and family structure directly influence expected medical costs.
MODELLING STRATEGY
My approach follows the classical actuarial frequency–severity framework used in real world insurance pricing. I began by generating a realistic synthetic portfolio of policyholders with diverse demographic and health profiles, including age, BMI, smoking status, and number of dependents. This formed the foundation for modelling risk in a controlled but realistic environment.
Claim frequency and claim severity were then modelled separately to reflect their fundamentally different behaviours. By keeping these components distinct, the model remains interpretable and aligns closely with regulatory and industry best practices. Once both components were estimated, they were combined to produce expected annual healthcare costs for each policyholder. These expected costs were then directly translated into individualised risk-based premiums.
To make the results intuitive and accessible, I deployed the pricing model into an interactive dashboard. This allows users to adjust their personal characteristics in real time and immediately see how their premium responds to changes in risk.
TECHNICAL BREAKDOWN
My approach was to recreate how real insurers think about risk, first by generating a realistic population with diverse health and lifestyle characteristics, and then modelling how often people claim and how costly those claims are. I combined these insights into a simple, interactive interface that lets users adjust their profile and instantly see how their premium changes. The goal was to make a complex actuarial process feel transparent, intuitive, and easy to explore.
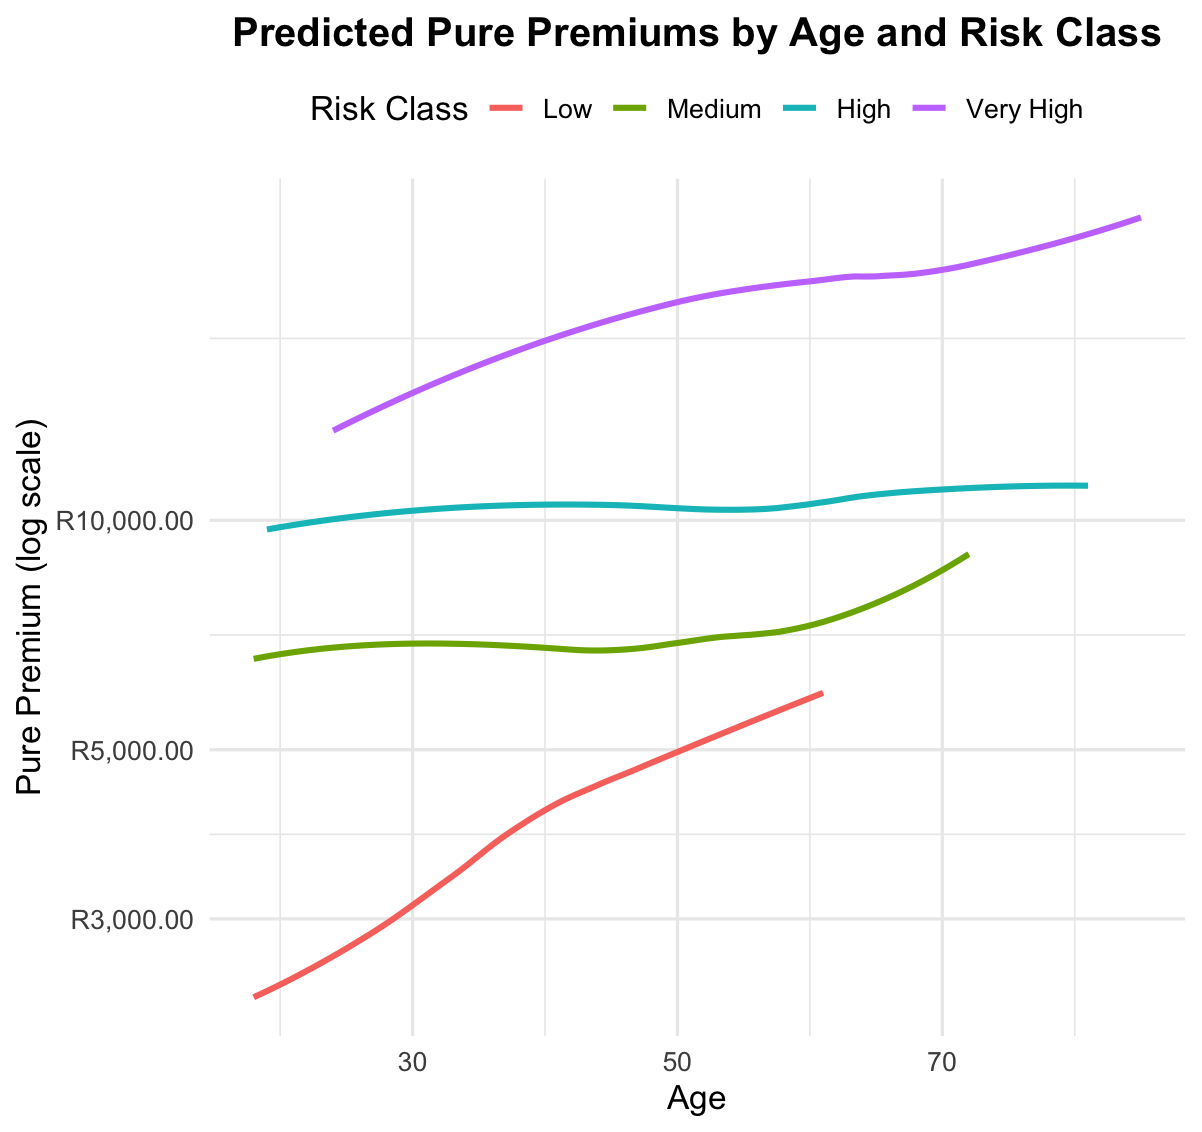
Model performance was evaluated using standard diagnostic checks to ensure stability, plausibility, and predictive consistency across risk segments. The final pure premiums were calculated as the product of predicted frequency and predicted severity, producing a fully risk-differentiated pricing structure.
The completed model was then integrated into a Shiny-based interactive interface, transforming a complex actuarial process into a user-friendly pricing tool. This step highlights my ability not only to build statistically sound models, but also to deploy them as practical, business-ready applications.