Quantitative Risk Management System
This project lets users build and analyse a customised JSE equity portfolio using real market data from Yahoo Finance. The tool runs thousands of Monte Carlo simulations, computes optimal weights, evaluates risk measures, and even performs scenario based stress testing, all in one place.
Category
Quantitative Finance
Language
R
Start Date
December 02, 2025
Designer
Sbusiso Mdingi
Interactive Quantitative Risk Management System
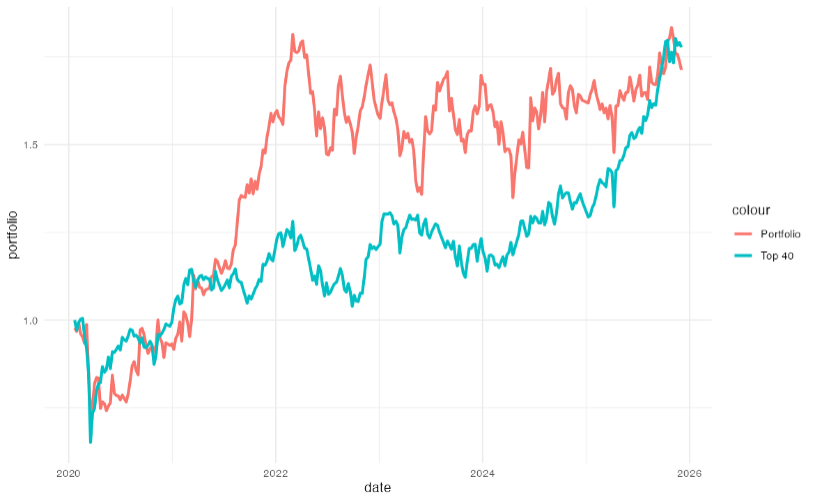
This interactive quantitative risk management system is an investment analytics dashboard built using R and Shiny. It enables users to construct portfolios of JSE-listed stocks, analyse how different asset allocations affect performance, and compare portfolio growth against the JSE Top 40 index.
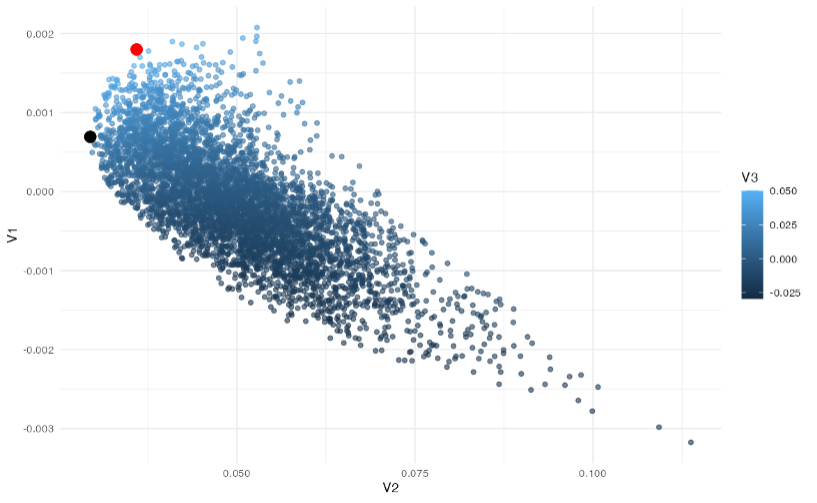
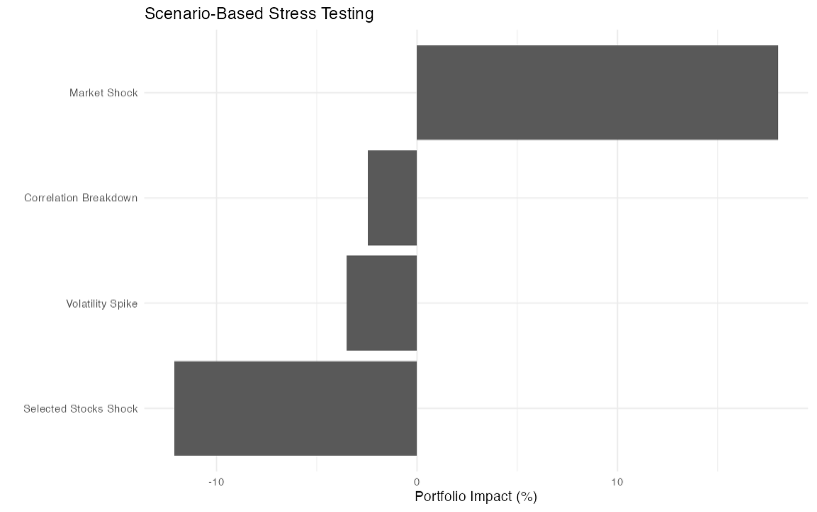
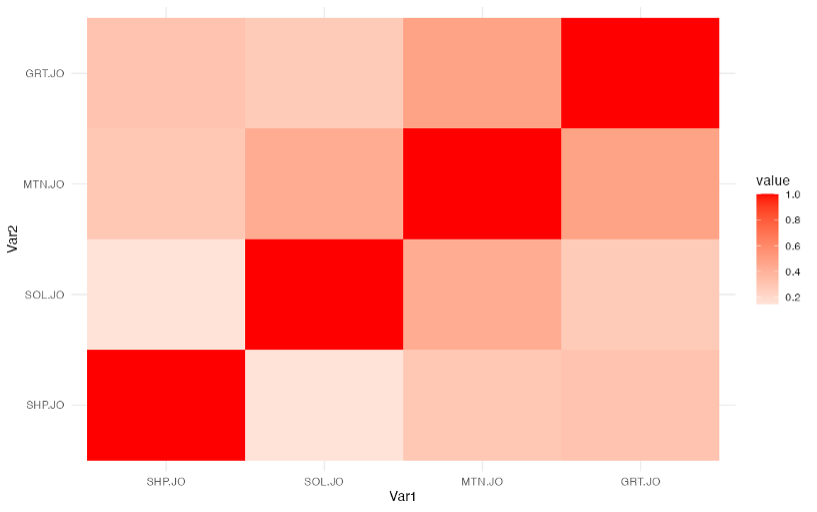
The system allows users to explore asset correlations, simulate thousands of random portfolios, and identify optimal allocations based on risk–return trade-offs. Advanced stress testing functionality evaluates portfolio behaviour during market shocks and periods of elevated volatility, supporting practical risk-aware investment decision-making.
THE STORY
When I first started exploring portfolio optimisation, all the examples I found online focused on US markets. But as someone based in South Africa, I wanted a practical tool that works with local JSE assets, something an individual investor here could actually use.
That gap inspired me to build a real world portfolio simulator from scratch using weekly stock data directly sourced from Yahoo Finance. I wanted to create something more than a static chart: a tool where the user could experiment with different stocks, visualise risk, understand diversification, and benchmark their portfolio against the JSE Top 40.
My APPROACH
I collected weekly JSE price data from Yahoo Finance, transformed it into log returns, and simulated thousands of random portfolios to model the efficient frontier. I then identified the minimum-variance and maximum-Sharpe portfolios and visualised their weight allocations. I benchmarked the optimal portfolio against the JSE Top 40 and added a stress-testing module to model market shocks, volatility spikes, and correlation breakdowns. The dashboard brings together portfolio optimisation, risk analytics, and interactive visualisation in a single tool.